
About the Site Overview page
Last updated 2024-04-02
The Site Overview page allows you to view metrics for a site via system-generated and custom dashboards.
Before you begin
Be sure you know how to access the web interface controls.
About the Site Overview page
The Site Overview page allows you to control:
- the specific system-generated or custom dashboard for which to display metrics
- the time frame over which to display data
Different metrics appear depending on the dashboard you've selected. Hovering over any part of a graph displays a timestamp indictor that updates itself as you move your cursor.
At the bottom of each card are buttons that provide more details about the data in each graph.
Clicking on Quick Look displays a summary view of the data in the graph.
Clicking on View Requests takes you to the Requests page with data from the graph applied in the search filter. The Requests page shows individual requests that contain attack or anomaly data.
Overview dashboard
The Overview dashboard provides a high-level, system-generated overview of metrics related to your site. It includes the following cards:
- Request volume: a graph displaying the number of requests the site received over time.
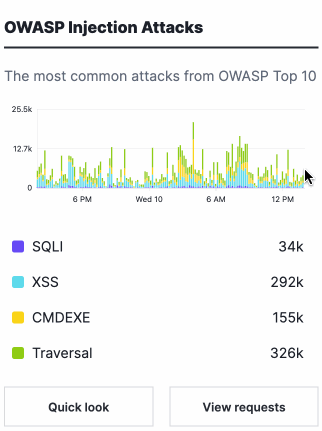
- OWASP Injection Attacks: a graph displaying the most common OWASP Top 10 attacks the site received over time.
- What's new: a list of the latest Next-Gen WAF feature announcements.
- Scanners: a graph displaying the number of commercial and open source scanning tools over time.
- Traffic Source Anomalies: a graph displaying the number of requests from unusual or suspicious sources over time.
- Events: a list of IPs that were flagged for exceeding thresholds. Click View all events to open the Events page.
- Request Anomalies: a graph displaying the number of anomalous behaviors within request headers over time.
- Response Anomalies: a graph displaying the number of client and server error codes over time.
- Suspicious IPs: a list of IPs that are approaching thresholds. Once the threshold is met or exceeded, the IP address will be flagged and added to the Events list. If the agent mode is set to blocking, then all malicious requests from flagged IPs are blocked (without blocking legitimate traffic).
- Authentication: a graph displaying the number of attempts to log in to application endpoints over time.
- Top Attacks: a list of the top URLs containing attack signals.
API Protection dashboard
The API Protection dashboard provides system-generated data about API protection signals. It includes the following cards:
- Enumeration: a graph displaying the number of attempts to access enumerated resources over time.
- Request anomalies: a graph displaying the number of anomalous behaviors within request headers over time.
- Injection attacks: a graph displaying the number of OWASP attacks associated with API abuse over time.
- Serialization anomalies: a graph displaying the number of request errors over time. The errors may indicate autonomous clients.
- Request violations: a graph displaying the number of requests violating common controls over time.
- Traffic source anomalies: a graph displaying the number of requests from unusual or suspicious sources over time.
ATO Protection dashboard
The ATO Protection dashboard provides system-generated data about account takeover (ATO) signals. It includes the following cards:
- Login: a graph displaying the number of attempts to log in to application endpoints over time.
- Password reset: a graph displaying the number of attempts to reset passwords over time.
- Account creation: a graph displaying the number of attempts to create accounts over time.
- Account changes: a graph displaying the number of changes to sensitive account information over time.
- Anomalies: a graph displaying the number of requests from unusual or suspicious sources over time.
- Gift card validation: a graph displaying the number of attempts to validate gift card details over time.
- Credit card validation: a graph displaying the number of attempts to validate credit card details over time.
- Spam: a graph displaying the number of requests to application messaging features over time.
Bot Management dashboard
The Bot Management dashboard provides system-generated data about suspected bot signals. It includes the following cards:
- Verified Bot Activity: a graph displaying verified bots represented on a per-category basis.
- Bot Activity: a graph displaying the number of requests made by suspected bots, suspected bad bots, and verified bots over time.
- Client Challenge Tokens: a graph representing requests that were verified by the
Verify Tokenrule action and labeled as either providing a valid or an invalid challenge token. - Authentication: a graph displaying the number of attempts to log in to application endpoints over time.
- Traffic Source Anomalies: a graph displaying the number of requests from unusual or suspicious sources over time.
What's next
Learn how to work with custom dashboards on the Site Overview page.
Do not use this form to send sensitive information. If you need assistance, contact support. This form is protected by reCAPTCHA and the Google Privacy Policy and Terms of Service apply.
