
Using site dashboards
Last updated 2023-06-09
Site dashboards provide collections of metrics represented as cards on the Site Overview page. There are two types of dashboards:
- System-generated: These dashboards display cards that provide an overview of the most commonly useful system signals related to request anomalies and attacks directed at your site. You cannot modify system-generated dashboards.
- Custom: These dashboards display cards with metrics you've personally selected as useful system signals related to request anomalies and attacks directed at your site. Custom dashboards allow you to rearrange and edit the display of those signals to best suit your needs.
Limitations and considerations
Keep in mind that only Premier and Professional platforms support both system-generated and custom dashboards as part of your Site Overview. The Essentials platform only supports system-generated dashboards. For a complete list of available features at each platform level, check out our product description.
Viewing a dashboard
To view a system-generated or custom dashboard, follow these steps:
Click the name of your site in the upper left corner of the web interface.
Click the arrow next to the name of the current dashboard.
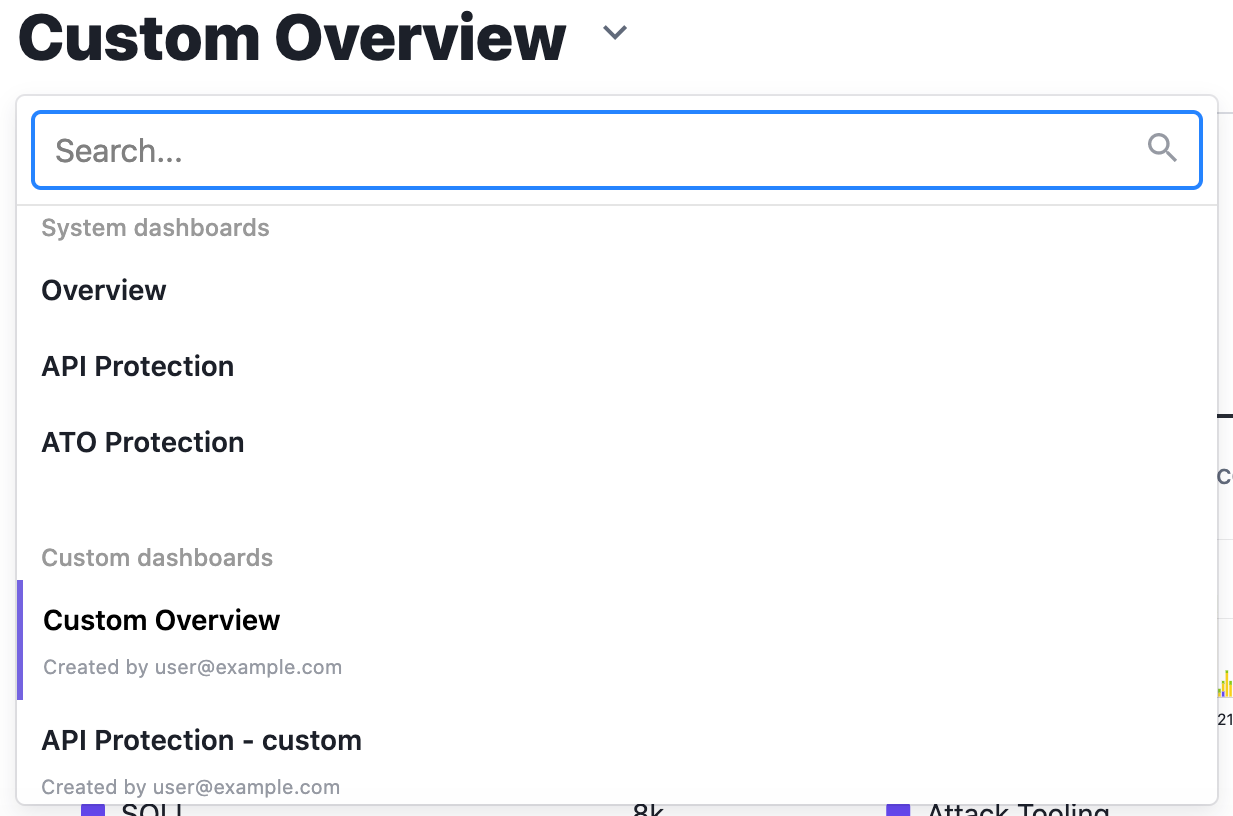
From the dashboards menu, select the dashboard you want to switch to. You can narrow down the list by using the search field. The selected dashboard appears.
Viewing a dashboard in monitor view
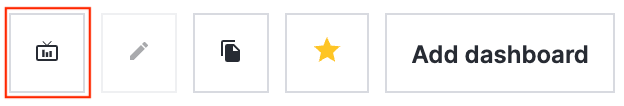
Clicking Monitor view, which appears as a small monitor icon at the top of the dashboard, displays your dashboard in focus mode. Focus mode displays the Site Overview page as you’ve customized it and temporarily hides the rest of the web interface. While in focus mode, you can create a read-only URL so that you can view your dashboard on a TV.
To set up monitor view on a TV:
On the Site Overview page, select the relevant dashboard from the Dashboard menu.
Click Monitor view. The Site Overview page appears in focus mode in the default grid view.
Click Share.
Click the Read-only URL switch.
Copy the link and open it on the TV you’d like to display the dashboard on.
You can change the focus mode view from the default grid view to carousel view by clicking Carousel. In the carousel view, the monitor will cycle through all cards on the Site Overview page. If necessary, you can generate a new URL, which invalidates the old URL. You can also disable the read-only URL altogether.
Setting a default dashboard
You can select a default dashboard that will automatically be selected when you log in to the web interface.
- On the Site Overview page, select the relevant dashboard from the Dashboard menu.
- Click the star in the upper-right corner of the Site Overview page. The displayed dashboard becomes your default dashboard.
Working with custom dashboards
On the Site Overview page, you can create, duplicate, rename, and delete custom dashboards.
Creating a custom dashboard
To create a custom dashboard, follow these steps:
- On the Site Overview page, click Add dashboard.
- Fill out the Add custom dashboard controls as follows:
- In the Name field, enter the name of the new dashboard.
- (Optional) Click Choose default cards to display the default cards you can select to add to the custom dashboard.
- Click Create dashboard. Your newly created dashboard appears on the Site Overview page.
Duplicating a dashboard
To duplicate a dashboard, follow these steps:
- On the Site Overview page, select the relevant dashboard from the Dashboard menu.
- Click the two stacked documents in the upper-right corner of the overview page. A duplicate of the selected dashboard appears on the Site Overview page.
Renaming a custom dashboard
To rename a custom dashboard, follow these steps:
- On the Site Overview page, select the relevant dashboard from the Dashboard menu.
- Click the pencil in the upper-right corner of the Site Overview page.
- In the Name field, enter a new name for the dashboard.
- Click Update dashboard. The renamed dashboard appears on the Site Overview page.
Deleting a custom dashboard
To delete a custom dashboard, follow these steps:
- On the Site Overview page, select the relevant dashboard from the Dashboard menu.
- Click the pencil in the upper-right corner of the Site Overview page.
- Click the Delete dashboard and then Delete dashboard. The dashboard is deleted.
Working with cards
You can surface relevant metrics on custom dashboards by adding cards that highlight meaningful data, editing cards to display specific signals, arranging the cards into a preferred layout, and deleting cards that aren't needed anymore.
Adding preset cards
To add a preset card to a custom dashboard, follow these steps:
- On the Site Overview page, select the relevant dashboard from the Dashboard menu.
- Click Add card in the empty card slot at the end of the dashboard.
- Select a preset card type.
- Fill out the Add card window as follows:
- In the Title field, enter a title for the card.
- In the Description field, enter a description for the card.
- From the Signals menu, select the signals the card will track. You can search for specific signals within the list by entering the name of the signal you want to search for.
- Click Create card. The card is added to the dashboard.
Adding custom cards
To add a custom card to a custom dashboard, follow these steps:
- On the Site Overview page, select the relevant dashboard from the Dashboard menu.
- Click Add card in the empty card slot at the end of the dashboard.
- Select Signals request chart: to create a card with a bar graph or Signals trend list: to create a card that lists each signal and the percentage each signal increased or decreased over the selected time period.
- Fill out the Add card window as follows:
- In the Title field, enter a title for the card.
- In the Description field, enter a description for the card.
- From the Signals menu, select the signals the card will track. You can search for specific signals within the list by entering the name of the signal you want to search for.
- Click Create card. The card is added to the dashboard.
Editing cards
To edit a card on a custom dashboard, follow these steps:
- On the Site Overview page, select the relevant dashboard from the Dashboard menu.
- Click the pencil that appears when you hover over the upper-right corner of the card you want to edit.
- Fill out the Edit card window as follows:
- In the Title field, enter a new title for the card.
- In the Description field, enter a new description for the card.
- From the Signals menu, remove signals by clicking the
xicon in the name or add signals by selecting them from the menu.
- Click Update card. The card is updated.
Rearranging cards
To arrange custom dashboard cards into a preferred layout, follow these steps:
- On the Site Overview page, select the relevant dashboard from the Dashboard menu.
- Click the four-way arrow that appears when you hover over the upper-right corner of a card, and then drag the card to the preferred location on the dashboard.
Removing cards
To remove a card from a custom dashboard, follow these steps:
- On the Site Overview page, select the relevant dashboard from the Dashboard menu.
- Click the pencil that appears when you hover over the upper-right corner of the card.
- Click Delete card and then Delete. The card is removed from the dashboard.
Do not use this form to send sensitive information. If you need assistance, contact support. This form is protected by reCAPTCHA and the Google Privacy Policy and Terms of Service apply.
