
About the DDoS Protection controls
Last updated 2025-03-31
In the Fastly control panel, use the DDoS Protection menu to access the pages associated with DDoS Protection.
- Log in to the Fastly control panel.
Go to Security > DDoS Protection and then select the link to one of the following pages:
- Dashboards, where you can view metrics related to attack requests and mitigations for each of your services.
- Events, where you can view the DDoS event details associated with a specific service.
About the Dashboards page
The Dashboards page displays metrics about request volumes over time for a specific service, as well as requests labeled as attacks and attack requests that were mitigated.
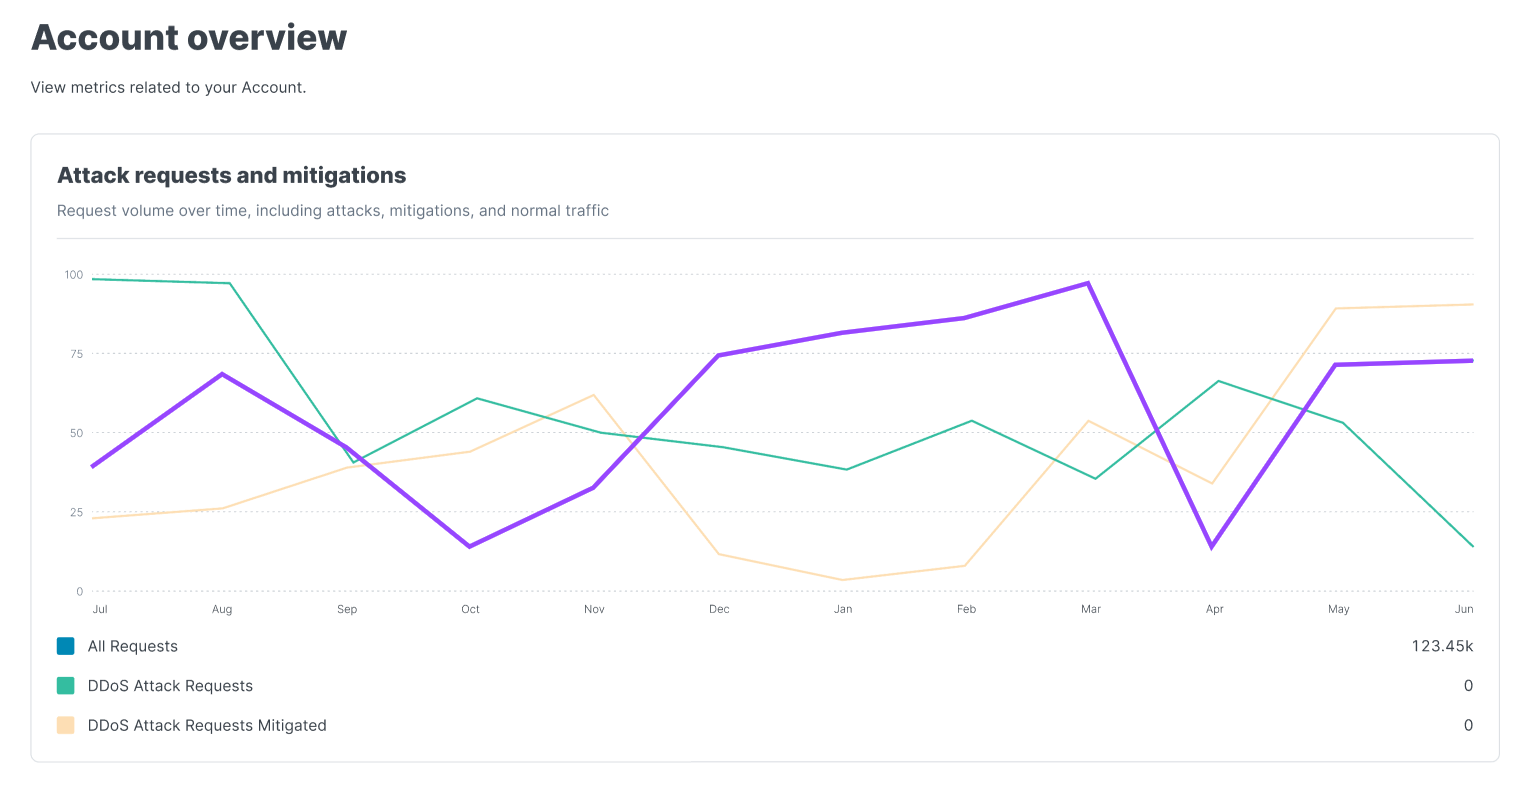
The controls on the Dashboards page allow you to filter the data displayed there:
- the Service menu allows you to specify the service that the metrics are drawn from.
- the Region menu allows you to limit the displayed metrics on any dashboard to a specific region around the world.
- the Time range menu allows you to change the timeframe over which metrics will be displayed. By default, the system displays 1 days worth of static data. The selected timeframe and time zone persist as you navigate between service dashboards.
- the Live button allows you to change displayed metrics to live data that changes in real time. Click Exit Live View to stop viewing the live data stream.
You can also learn more information by hovering over any part of the graph. This displays a timestamp indicator that updates as you move the cursor along with a service version indicator.
About the Events page
The Events page displays a list of the DDoS events associated with a service, including a basic summary of the details about it and the short-lived rules that were created to manage it. For example, if the system detects an unusual traffic spike, it may generate a temporary rule to filter or limit the impact.
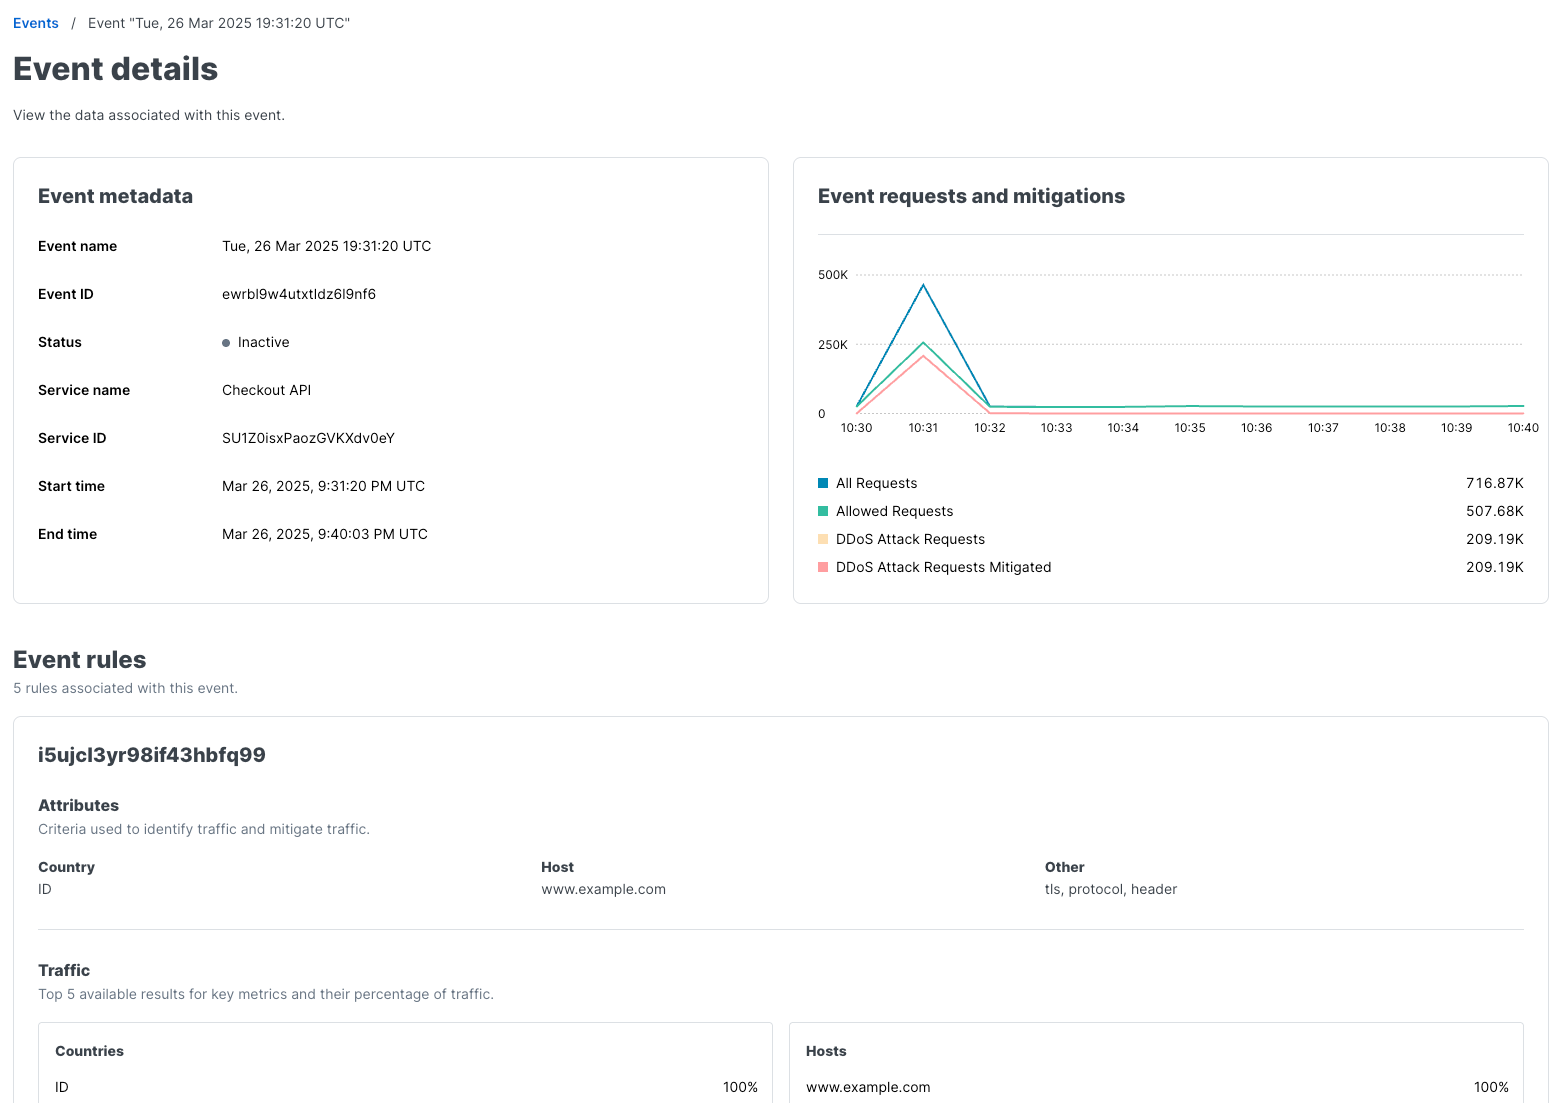
Clicking on the name of any event listed on the Events page takes you to expanded information about that event including:
- Event details provide information about a detected DDoS event, which represents a specific potential attack. Events are associated with a timestamp, detected or blocked traffic data (depending on whether Logging or Blocking mode is active), and one or more Event Rules. Customers can view key details such as the event’s name, unique ID, status, start and end times, peak traffic volume, and the list of rules applied to mitigate it.
- Event rules define the conditions and attributes used to filter or mitigate traffic for a DDoS event. These rules help manage traffic based on specific characteristics, such as IP addresses, Autonomous System Numbers (ASNs), countries, prefixes, and hostnames. Customers can review details including rule IDs, associated attributes, and a summary of traffic patterns by IP addresses, hostnames, user agents, and IP prefixes.
The information on the Events page can help you understand why traffic was identified as part of a potential DDoS attack and how mitigation rules were applied in response.
Do not use this form to send sensitive information. If you need assistance, contact support. This form is protected by reCAPTCHA and the Google Privacy Policy and Terms of Service apply.
