
- English
- 日本語
Working with custom dashboards
Last updated 2025-01-14
From the Observability pages, you can access custom dashboards that you build to make relevant metrics for a service more visible and accessible in a single location. Custom dashboards are disabled by default.
Before you begin
Be sure you know how to access the web interface controls and understand basic information about the Observability pages before learning about custom dashboards.
Limitations and considerations
Keep the following things in mind:
- Custom dashboards are disabled by default and are only available to customers who have purchased an Observability package. Once enabled, only users assigned the role of superuser or engineer can edit custom dashboards, but all account users will be able to view them.
- You are limited to 100 custom dashboards per account, once they've been enabled for you.
Accessing custom dashboards
To access and view a custom dashboard, follow these steps:
- Log in to the Fastly control panel.
- Go to Observability in the navigation sidebar.
- Click Custom dashboards.
- Click the linked name of the custom dashboard you want to view.
About the controls on Custom dashboard pages
On the each custom dashboard page, you can refine the metrics displayed and gain more information by:
- using the menu below the dashboard name to change the timeframe.
- hovering over any part of a graph to access a timestamp indicator that updates as you move the cursor.
- clicking the button at the bottom of a card to access information related to the metric.
For additional details about all the controls on the custom dashboard pages, check out our guide to the Observability controls.
Working with custom dashboards
From the Custom dashboards page, you can create, clone, share, and delete custom dashboards.
Creating a custom dashboard
To create a custom dashboard, follow these steps:
- On the Custom dashboards page, click Create dashboard.
- In the Dashboard Name field, enter the name of your custom dashboard.
- Click Save. The new custom dashboard appears, empty and ready to have charts added to it.
Cloning a custom dashboard
To clone an existing custom dashboard, follow these steps:
- On the Custom dashboards page, click Create dashboard.
- In the Dashboard Name field, enter the name of your custom dashboard.
- Click Clone.
- From the Clone from menu, select the existing dashboard you want to clone.
- Click Save. The new custom dashboard appears, duplicating all existing charts from the original dashboard.
Deleting a custom dashboard
Custom dashboards can be deleted individually and in bulk as follows:
- To delete a specific custom dashboard from the Custom Dashboards page, click the trash
 to the right of the dashboard name.
 - To delete multiple custom dashboards from the Custom Dashboards page, select the checkbox to the left of each dashboard you plan to delete and then click the Delete button above the list of custom dashboards.
- To delete a custom dashboard while viewing that specific dashboard, select Delete dashboard from the Options menu and click Delete on the confirmation window that appears.
Sharing a custom dashboard
To share a custom dashboard, follow these steps:
- Navigate to the dashboard that you want to share.
- Click Options and then select Copy link. The link is saved to your computer's clipboard.
- Manually share the link outside of the Fastly app.
To access a shared dashboard, you must have the appropriate permissions.
Working with custom dashboard charts
You can surface relevant metrics on custom dashboards by adding charts that highlight meaningful data and deleting existing charts that aren't needed anymore.
Adding a chart to a custom dashboard
To add a chart to a custom dashboard, follow these steps:
Navigate to the custom dashboard that you want to add a chart to.
Click Options and then select Edit dashboard.
Click Add Chart.
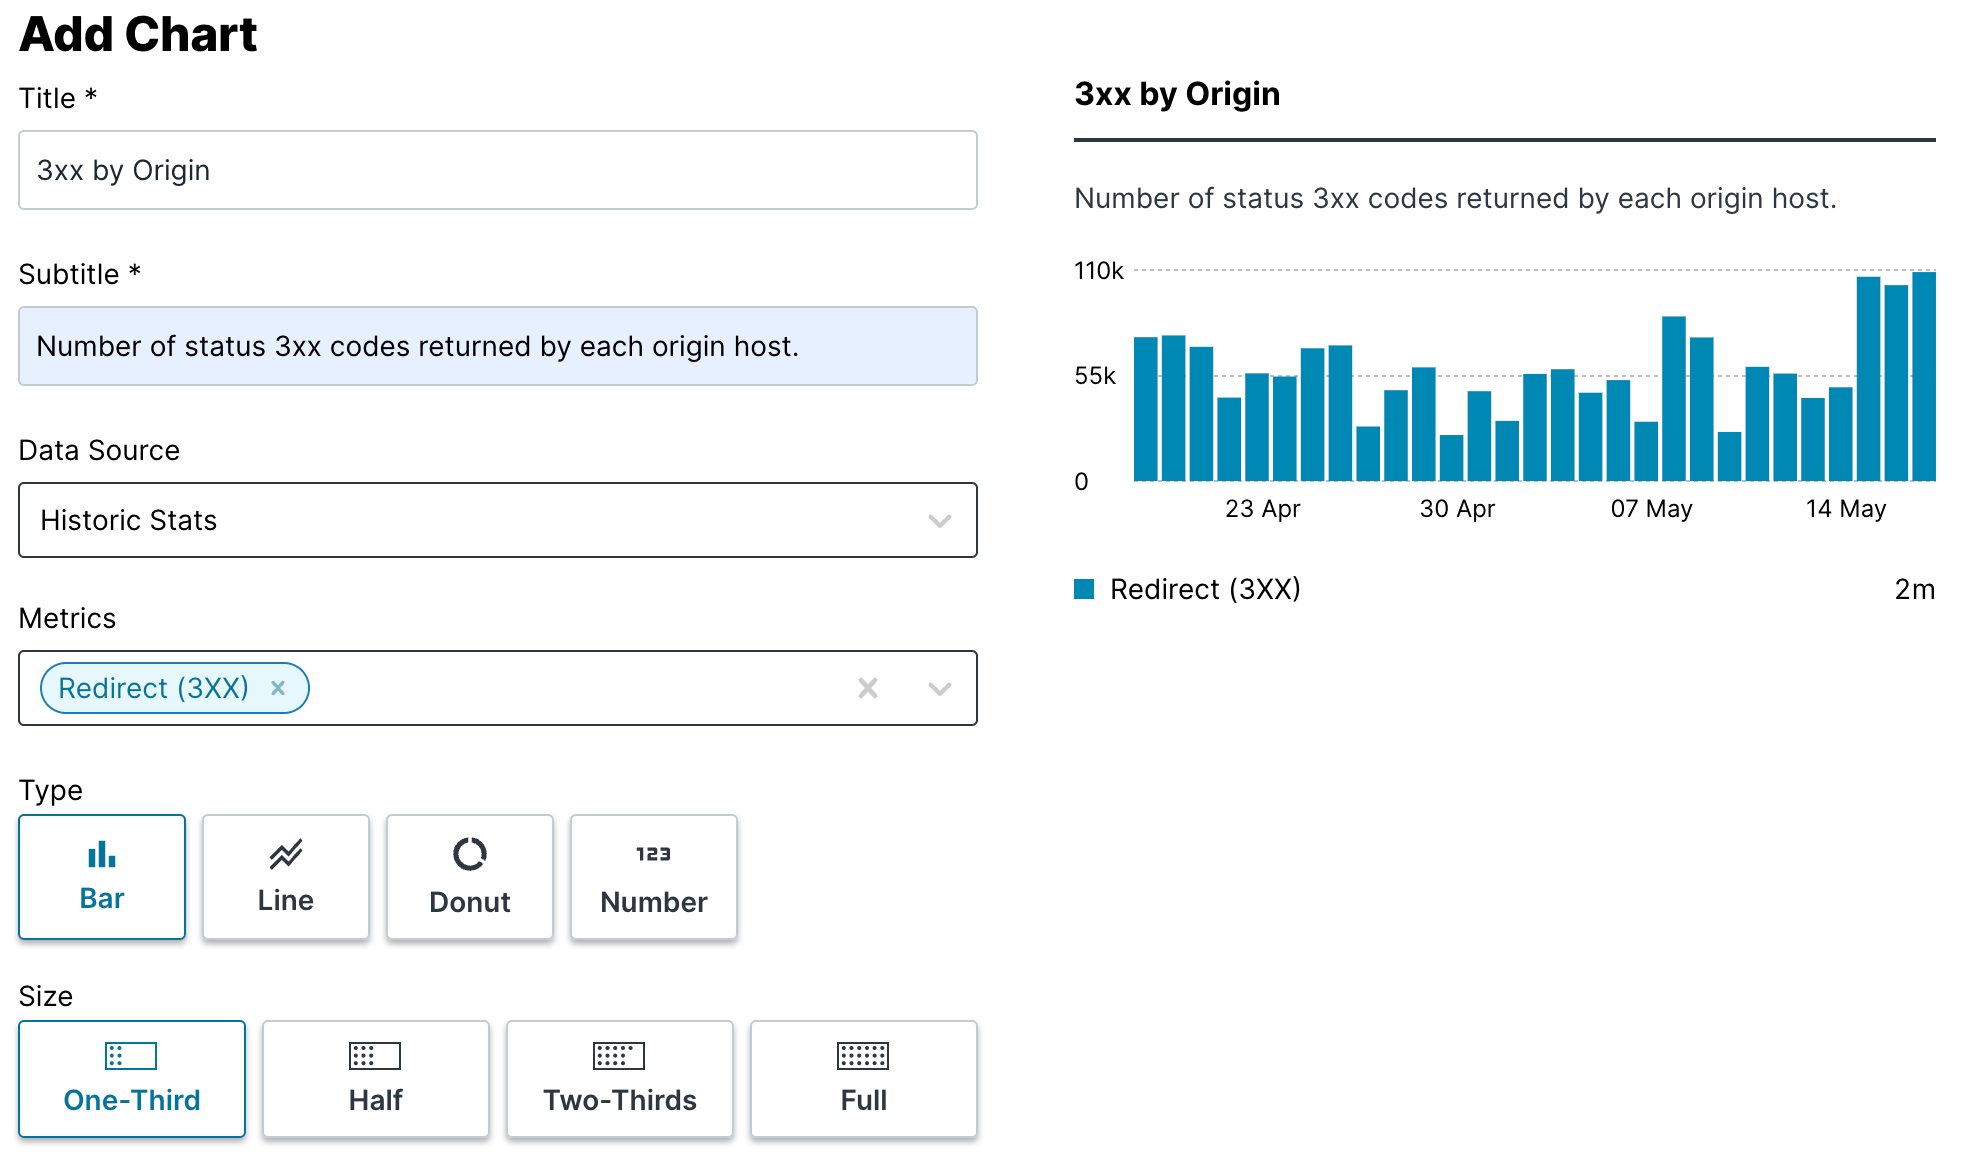
Fill out the Add Chart fields as follows:
- In the Title field, enter the name of the chart.
- In the Subtitle field, enter a brief description of the chart.
- From the Data Source menu, select a data pipeline. Data pipeline options include Historic Stats, Original Inspector, and Domain Inspector.
- From the Metrics menu, select the type of data the chart should report.
- From the Type menu, select an option to control how the data is displayed.
- From the Calculation Method menu, select the single metric the chart should report. This field only appears when the Type field is set to Donut or Number.
- From the Size menu, select an option to control the width of the chart.
A preview of the chart appears next to the form as you enter information and make selections.
Click Save. The chart is added to the dashboard.
Click Exit Edit Mode to return to view mode for the dashboard.
Rearranging charts on custom dashboards
To rearrange the charts on a custom dashboard, click and hold on any chart you want to move using your mouse, then drag it to the desired location and release the button.
Deleting a chart from a custom dashboard
To delete a chart from a custom dashboard, follow the steps below:
- Navigate to the custom dashboard that you want to add a chart to.
- Click Options and then select Edit dashboard.
- Click the trash to the right of the chart that you want to delete. The chart is removed from the dashboard.
- Click Exit Edit Mode to return to view mode for the dashboard.
What's next
Dig deeper into details about all areas of the web interface before you move on to working with services.Do not use this form to send sensitive information. If you need assistance, contact support. This form is protected by reCAPTCHA and the Google Privacy Policy and Terms of Service apply.
