
- English
- 日本語
Checking cache
Last updated 2024-03-26
Checking the cache status of an object on your website can help when troubleshooting problems. You can use the Fastly control panel or the curl command (an open-source command line tool for transferring data with URL syntax from or to a server using one of many supported protocols) to check Fastly's cache nodes for a cached object, and you can use the information provided to examine the object's status, response time, and content hash.
Using curl
You can use one of two curl commands to tell if your request is caching in the Fastly network:
- a simple curl command that displays the request and response headers for a given object
- a slightly more complex curl command that uses the
Fastly-Debugheader to expose information normally stripped by the simple curl command
Using the simple curl command
The following curl command displays the request and response headers for a given object:
$ curl -svo /dev/null www.example.com/index.htmlwhere www.example.com/index.html is replaced with the full object path of the object you're testing.
For example, using curl -svo /dev/null www.example.com produces something like the following section of output:
[...]
< Age: 142< X-Served-By: cache-jfk1041-JFK, cache-ord1720-ORD< X-Cache: HIT, HIT< X-Cache-Hits: 1, 7
[...]
This output tells us the current age of the object in cache. It also shows shielding is enabled because two cache nodes display in X-Served-By. However, we're most interested in the output of the X-Cache header. A properly caching object displays a value of X-Cache: HIT, X-Cache: HIT, HIT, X-Cache: HIT, MISS, or X-Cache: MISS, HIT.
Using a Fastly-Debug header with curl
The Fastly-Debug header provides additional information for debugging by exposing specific information that is normally stripped when using a simple curl command:
$ curl -svo /dev/null -H "Fastly-Debug:1" www.example.com/index.htmlwhere www.example.com/index.html is replaced with the full object path of the object you're testing.
For example, with optional shielding being used and a TTL set to 86400 (24 hours) using Surrogate-Control, the command curl -svo /dev/null -H "Fastly-Debug:1" www.example.com produces something like the following section of output:
[...]
< Surrogate-Control: max-age=86400< Surrogate-Key: articles articles/1 articles/2
[...]< Age: 403< Fastly-Debug-Path: (D cache-ord1722-ORD 1470672957) (F cache-ord1743-ORD 1470672629) (D cache-jfk1041-JFK 1470672629) (F cache-jfk1030-JFK 1470672554)< Fastly-Debug-TTL: (H cache-ord1722-ORD 85997.246 0.000 403) (H cache-jfk1041-JFK - - 75)< X-Served-By: cache-jfk1041-JFK, cache-ord1722-ORD< X-Cache: HIT, HIT< X-Cache-Hits: 1, 6
[...]
Because surrogate keys are present, the Fastly-Debug header exposes them. As with the simple curl command, this section of output tells us the current age of the object in cache. In addition, Fastly-Debug exposes specific header details to help with debugging as noted below.
Using the Fastly control panel
WARNING
When you click Check Cache, every Fastly cache node will send a request to your origin for the object. Clicking the button multiple times could overwhelm your origin with requests. Consider using curl to check the cache status instead.
Follow the steps below to check the cache status of an object using the Fastly control panel:
- Log in to the Fastly control panel.
- From the Home page, select the appropriate service. You can use the search box to search by ID, name, or domain.
Click Check Cache.
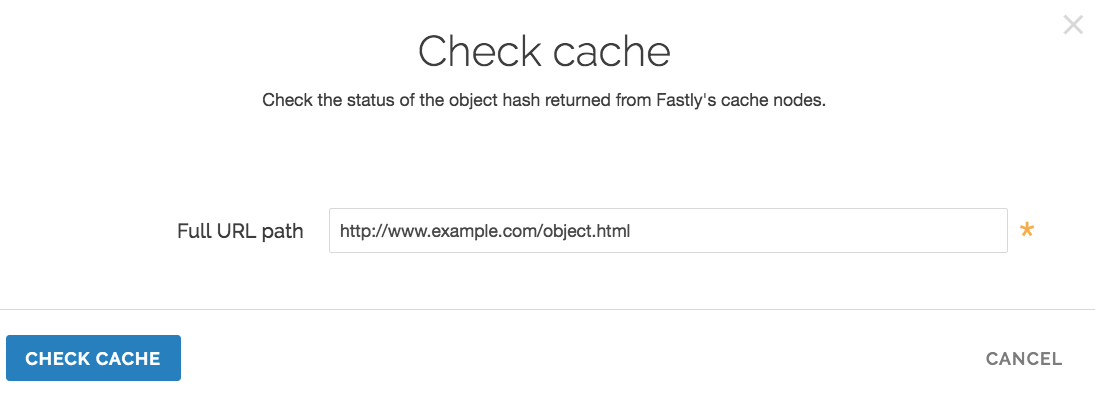
In the Full URL path field, enter the full path to the object (e.g.,
http://www.example.com/object.html).Click Check Cache. The results are displayed in the Check Cache window.
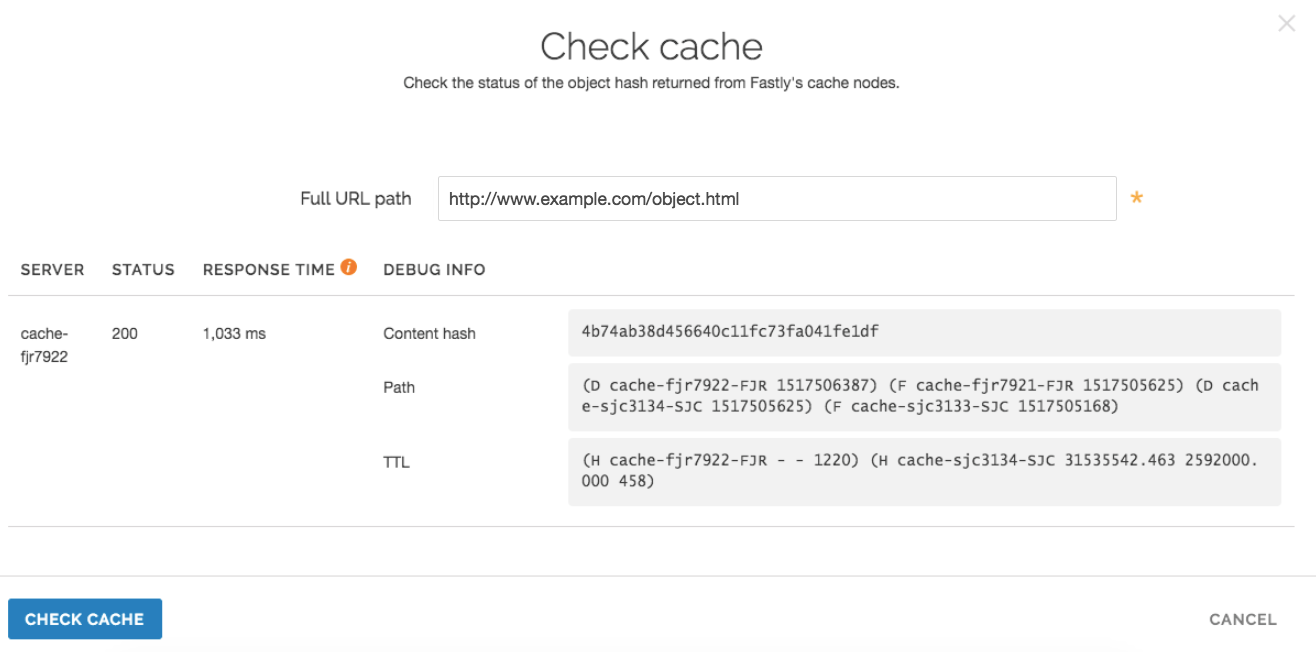
You can use this information to verify that the same copy of an object is stored on all of our servers. If the content hash is different across nodes, that usually indicates that there's a caching problem.
Information exposed by the Fastly-Debug header
Fastly-Debug Path contains information about which cache server handles fetching and delivery of an object. The edge POP appears first in the sequence and the shield POP appears second.
Drepresents which cache by name in the edge or shield ranvcl_deliverFrepresents which cache by name in the edge or shield ranvcl_fetch- the number following each specific server name is a timestamp in seconds
With shielding enabled, you should generally see four cache servers listed in this header. In rare cases where a cache server exists as both an edge and a shield within the cluster for that object, you may see two or three caches listed.
Fastly-Debug-TTL provides information on HIT and MISS timings.
Hrepresents a HIT, meaning the object was found in the cacheMrepresents a MISS, meaning the object was not cached at the time of the query
For each of these timings:
- the first number specifies the TTL remaining for the object
- the second number specifies the grace period
- the third number specifies the current age of the object in cache
It may take a few requests to see these numbers populate as expected because they need to either hit the cluster node or a node where the content already exists in temporary memory.
X-Served-By indicates the shield and edge servers that were queried for the request. The shield POP appears first in the sequence and the edge POP appears second.
X-Cache indicates whether the request was a HIT or a MISS for the data center.
NOTE
Our shielding debugging documentation provides in depth details key to understanding the X-Served-By, X-Cache, and X-Cache-Hits headers with shielded services.
Do not use this form to send sensitive information. If you need assistance, contact support. This form is protected by reCAPTCHA and the Google Privacy Policy and Terms of Service apply.
