
- English
- 日本語
About the Billing overview page
Last updated 2024-12-09
The Billing overview page allows you to view general billing information and bill-related metrics for your account broken down by product and region over key, monthly timeframes. When your user role allows, you access the Billing overview page by selecting Billing from the user quick links menu.
Before you begin
Be sure you know how to access the web interface controls before learning about the information you'll encounter here.
About the Billing overview page
This page provides high-level details about:
- the Current plan associated with your account, with links that allow you to view plan usage
- your most recent Invoices, with links to details about your bill for a specific month
- any Purchased products that have been added to your account
- Billing metrics in the form of graphs that show variable charges on your bill over time
About Purchased products
This page includes a card listing the products purchased for your account via the Fastly control panel and the date on which they were purchased. If you have not purchased products this way, you will not see this card.
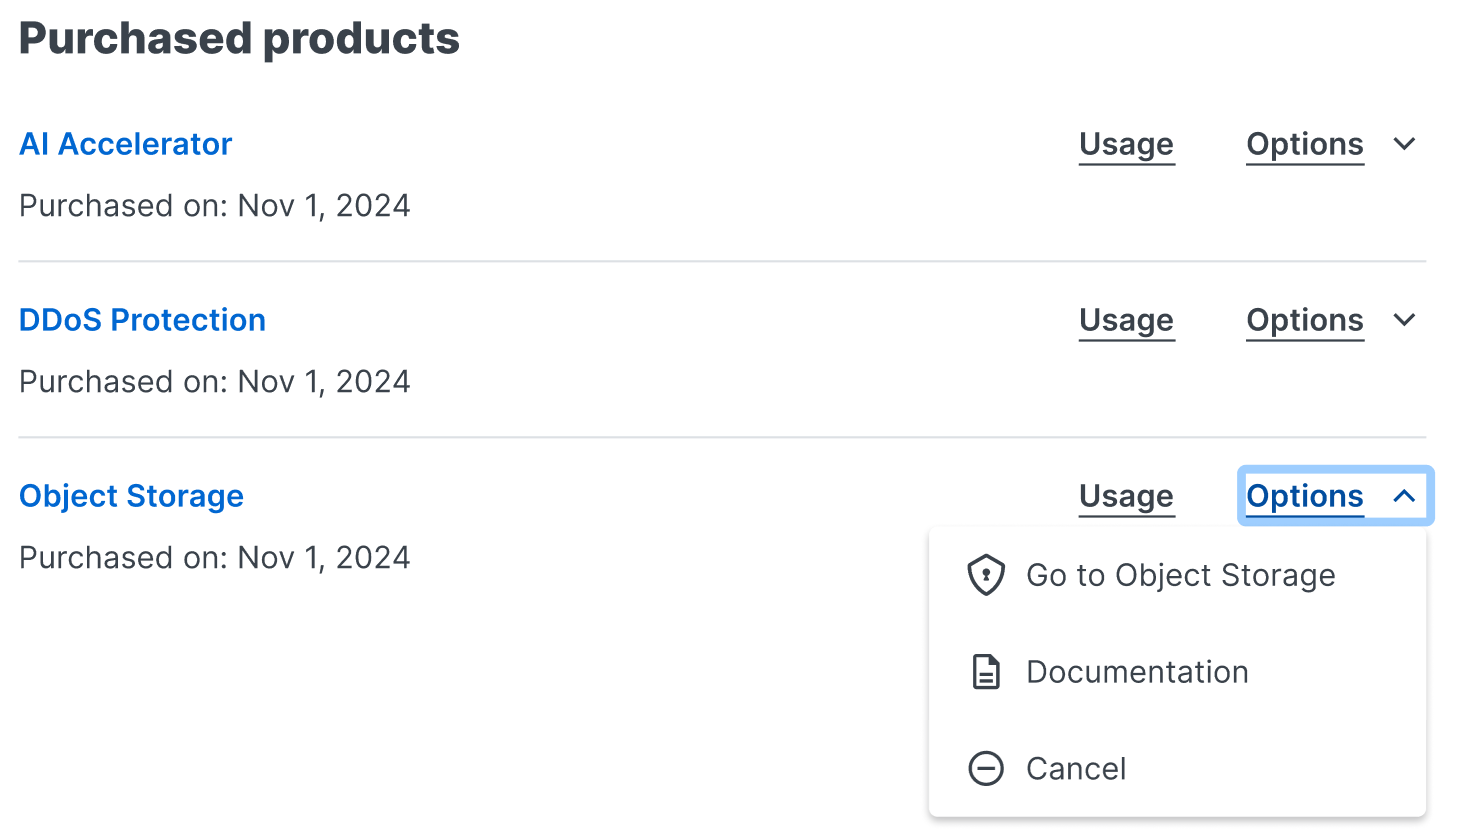
You can view the usage information related to your purchased products by clicking Usage. In the Options menu, you can find out more information about the product by clicking the Go to link for the product or Documentation. You can also click Cancel to start the cancellation process for any product you've purchased through the Fastly control panel.
About Billing metrics
A series of graphs appear that provide insights into what you're being charged for by Fastly and how that amount applies to the various products you've purchased and the regions in which traffic to your services operates.
These graphs include:
- the Total bill graph, which displays the total US dollar amount that Fastly has billed your account over a specific time period
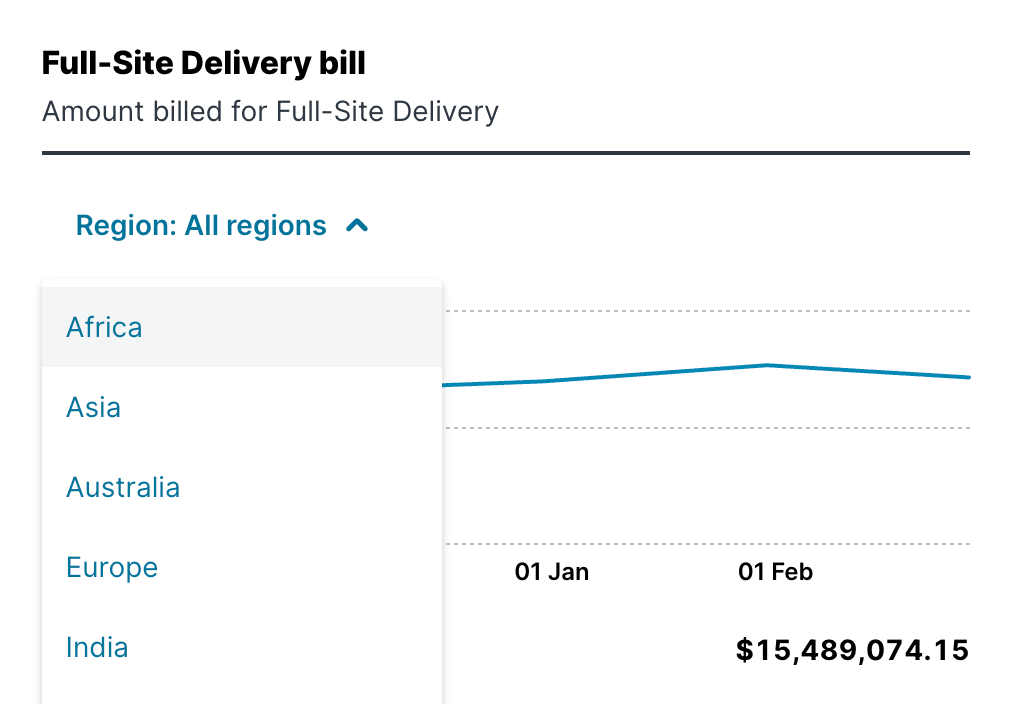
- the Full-Site Delivery bill graph, which displays the total US dollar amount your account has been billed for the Fastly Full-Site Delivery portion of your account's bill over a specific time period
- the Compute bill graph, which displays the total US dollar amount your account has been billed for Compute platform operations over a specific time period
- the Bandwidth graph, which displays the total bandwidth in gigabytes that has been processed for your account over a specific time period
- the Requests graph, which displays the total number of requests processed for your account over a specific time period
- the Other services & products graph, which displays the total US dollar amount that Fastly has billed your account for all Fastly products and services, not including Full-Site Delivery and Compute, over a specific time period
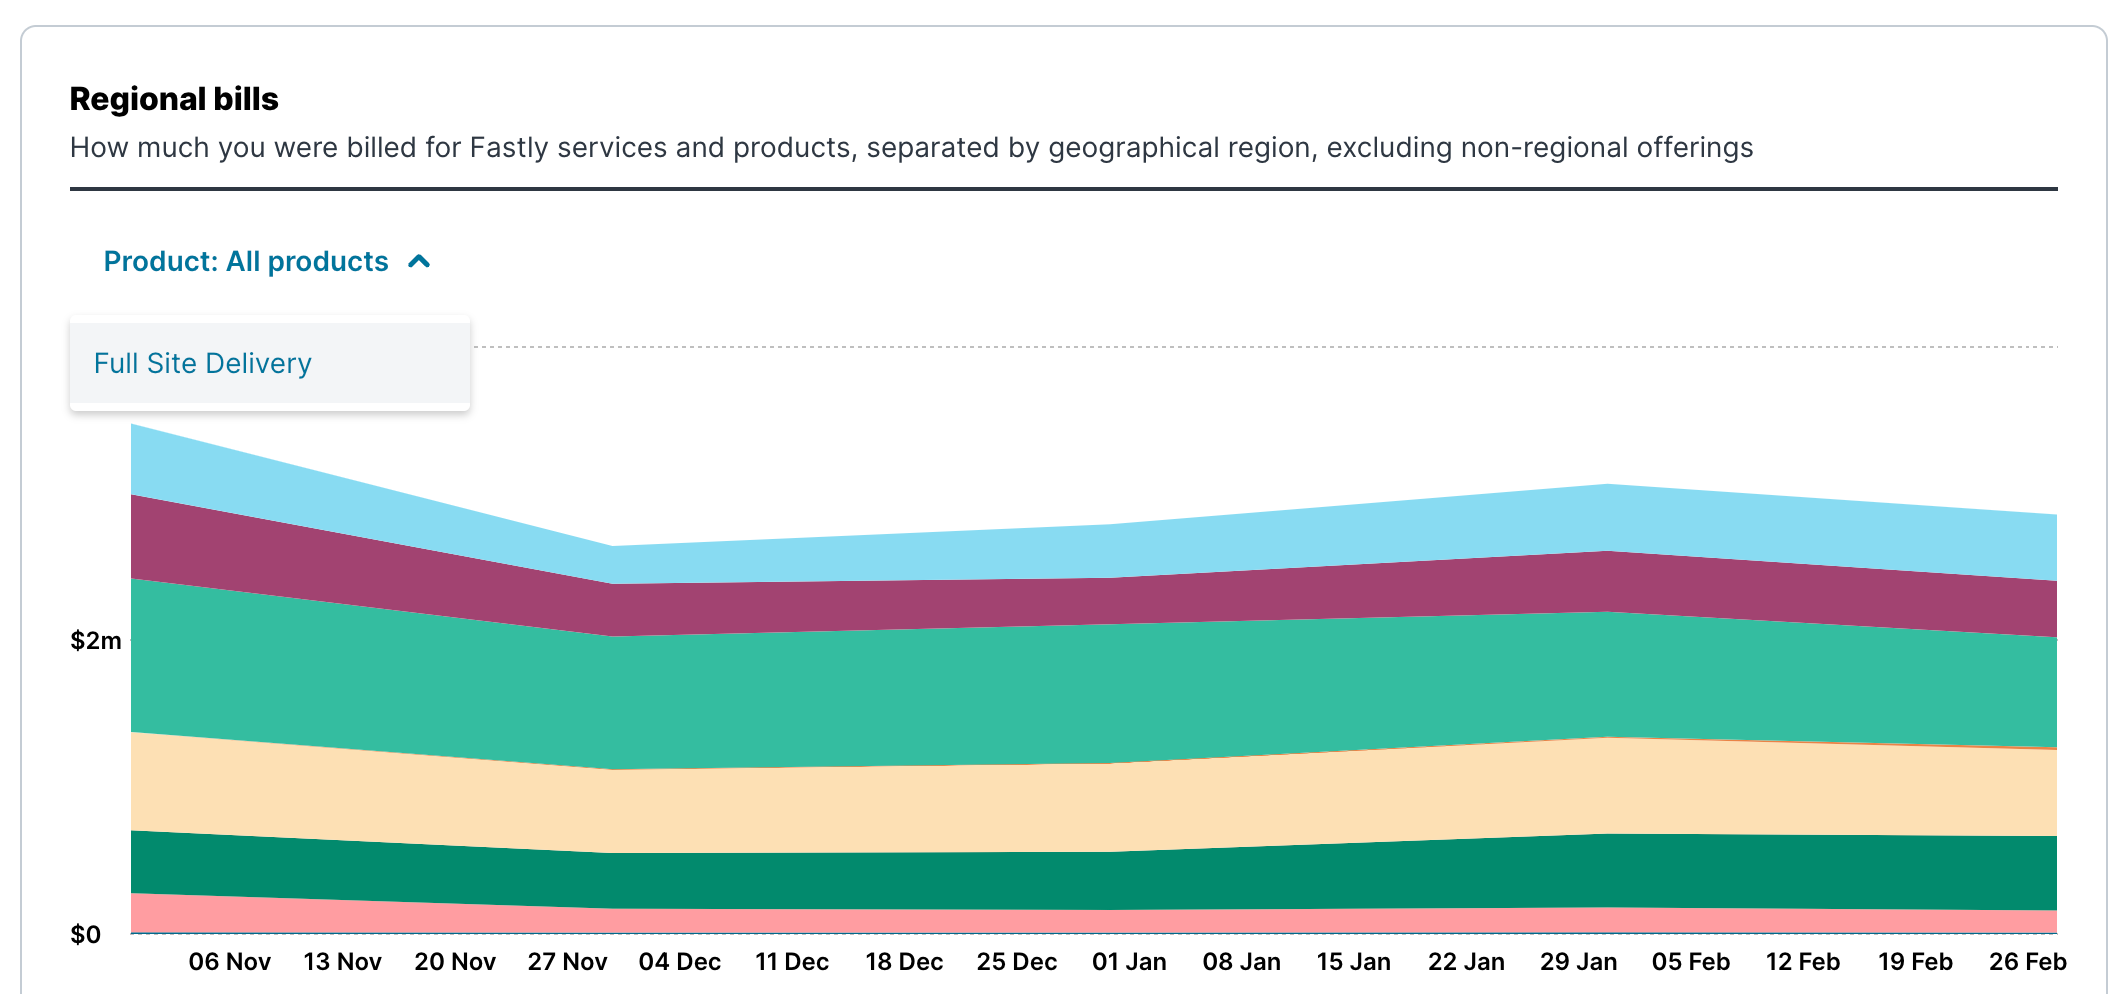
- the Regional bills graph, which displays how much you were billed for Fastly products and services within each geographical region of the world, excluding non-regional offerings, over a specific time period
When reviewing the metrics displayed on the billing graphs, keep the following things in mind:
- Data doesn't appear in real time. Unlike the metrics displayed in the Observability page graphs, data for billing metrics does not appear in real-time nor for time periods shorter than one month.
- Dollar amounts shown are for US dollars. For any graph displaying monetary amounts, these amounts appear in US dollars only.
Working with the Billing metrics graphs
You can interact with and control the Billing metrics graphs as follows.
Limiting data to specific geographic regions or products
By default any graph that displays metrics for regional offerings displays data for all regions. You can change these to display data for specific regions by selecting a specific region from the Region menu near the top of each graph.
Likewise, the Regional bills graph displays metrics for all products you currently pay for. You can change this to display data for a specific offering by selecting it from the Product menu near the top of the graph.
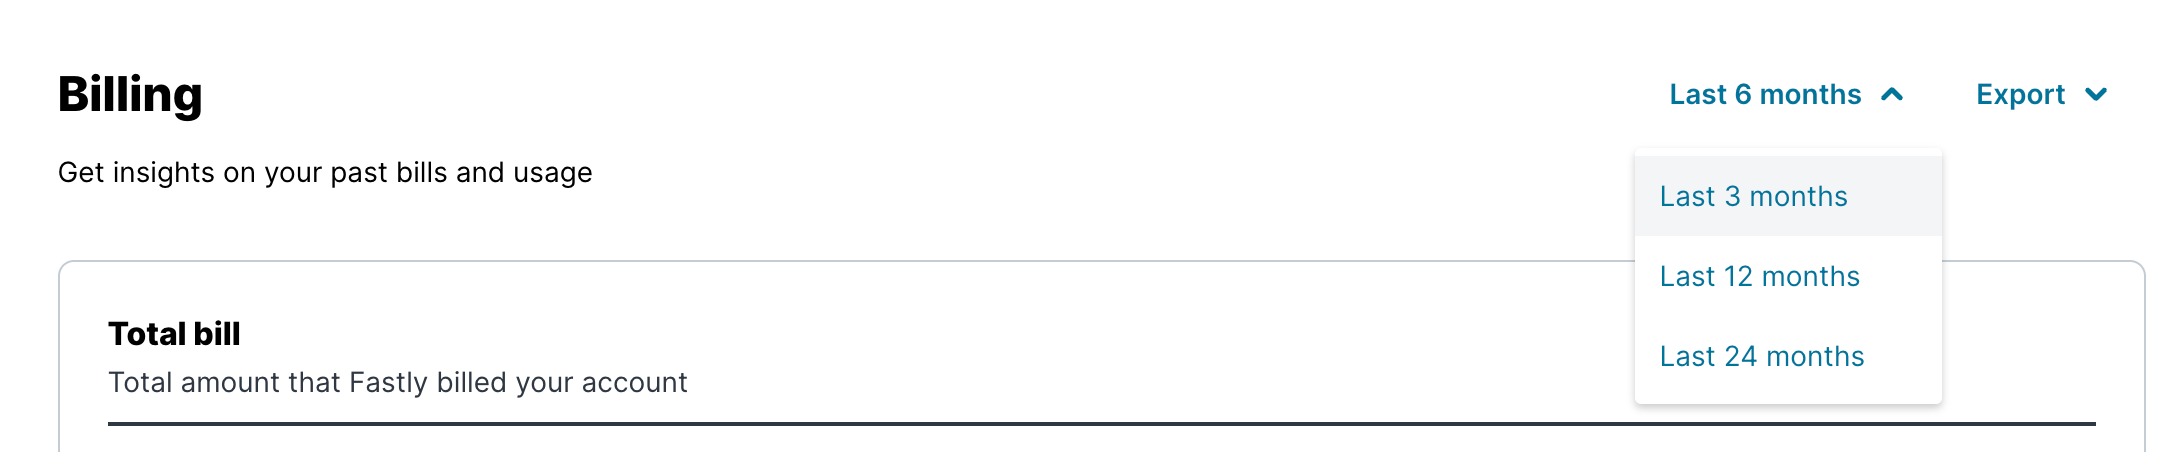
Changing displayed time periods
By default all graphs display billing data for the past six months. You can change this by selecting a new time frame from the month control at the top of the page to a maximum of 24 months.
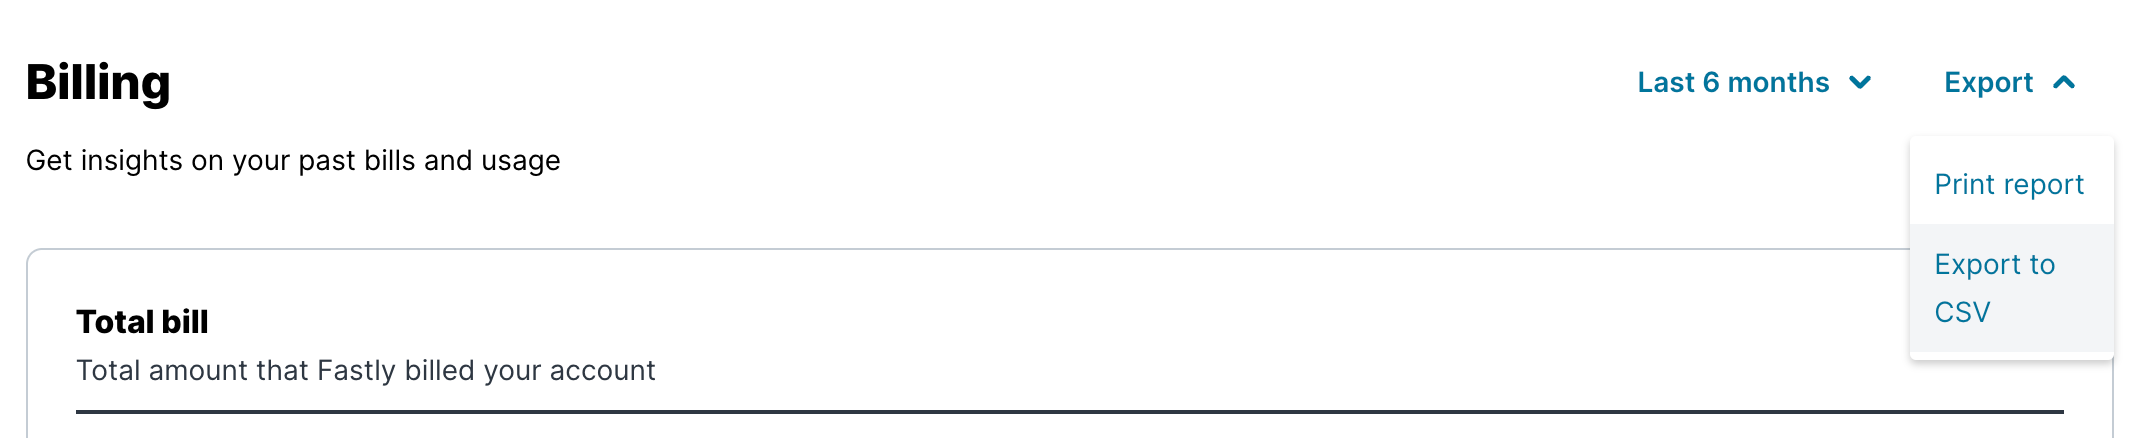
Printing and exporting billing data
You can print a report of your billing data by selecting Print from the Export menu at the top of the page. This will launch the printing controls for your browser and allow you to send the report to a printer or create a PDF version of the data for the time period you've selected.
You can create an exportable version of your billing data by selecting Export to CSV from the Export menu at the top of the page. This will automatically download a CSV-formatted text file to a local directory.
What's next
Dig deeper into details about all areas of the web interface before you move on to working with services.Do not use this form to send sensitive information. If you need assistance, contact support. This form is protected by reCAPTCHA and the Google Privacy Policy and Terms of Service apply.
